
Madison, Wisconsin and Baltimore, Maryland: a tale of two studies
As we discussed in Part I of this series, many experiments ranging from those involving yeast, worms, flies, and rodents have suggested that calorie restriction (CR) can extend lifespan. So when the Wall Street Journal ran the headline, Study Finds Low-Calorie Diet Extends Lifespan of Monkeys, in response to an experiment showing the purported benefits of CR (Colman et al., 2009), it didn’t seem controversial or especially noteworthy.
But this was remarkable for a few reasons. These were monkeys. This study, conducted at the University of Wisconsin (UW),1 will be 30 years old in 2019, a marvel of longevity in and of itself. The study was also rigorously controlled. If we can put ethics aside, these were captive subjects (individually caged) that had each meal provided to them by investigators.
Researchers can’t do these types of long-term definitive studies in humans primarily because of three reasons. First, they are prohibitively expensive. Second, they take a long time to conduct. Third, they are too hard to do. (You can put ethics in this last category, too.) As far as translatability to humans, the UW and NIA studies may be the closest we’re going to get. Rhesus monkeys (if we’re referring to “monkeys” in this post, we mean rhesus monkeys unless otherwise noted)2 share approximately 93% sequence identity with the human genome. By contrast, approximately 40% of the human genome can be aligned to mice (Mouse Genome Sequencing Consortium, 2002). In addition, their anatomy, physiology, endocrinology, immunology, and neurology parallel ours (Colman and Kemnitz, 1998).
The UW study was run in parallel with another study at the U.S. National Institute on Aging (NIA) in Baltimore, Maryland. In fact, the NIA study kicked off in 1987, two years before the UW. However, the NIA study didn’t publish their results on survival until 2012, three years after the UW initial publication.
These two CR (a target of 30% lower intake than controls) studies were carried out over 20 years (and now approaching 30 years) with all of the monkeys followed until death. The median lifespan of a rhesus monkey in captivity is about 27 years and the maximum lifespan is about 40 years (Colman et al., 2009). If we take a look at the UW data from 2009, from a semantical standpoint, the study didn’t find CR extends the lifespan of rhesus monkeys, despite the headlines in the lay press.
The investigators were comparing median survival between the CR and control (CON) groups, not longevity or lifespan per se. To understand the difference, consider the following (exaggerated) example: if the CR group had a median survival of 18 years, and the CON group a median survival of 12 years, there is likely an effect of CR increasing survival in these monkeys. But if the typical median lifespan of monkeys is ~ 27 years, there is no lifespan extension in either group relative to the species. In fact, in this hypothetical, there is an observed decrease in lifespan in both the CON and CR groups.
Another example: if the battery life of our MacBook is about two hours on average and reaches 50% power at one hour (think of this as median survival), and yours (same make, model, etc.) is four (and reaches 50% power, or median survival, at two hours), your battery’s life is twice as long as ours. All things equal, if the battery life of this make, model and life cycle of a MacBook has an average battery life of five hours, we can’t say your MacBook, or anything that you’ve done to maintain it (say, charger restriction) has extended the life of your battery. Maybe it did compared to ours, but an important question is why is your battery life still an hour shorter than the average battery life of a MacBook at this stage? (If you’re still confused about median survival and lifespan, as we were, we made a glossary to try and help.)
What did the UW study find in terms of 50% survival (i.e., the average age of the remaining monkeys when half the monkeys in the respective cohort have died)?3 Without getting into the statistical jargon (click on the footnote preceding this sentence for that), in terms of median survival, the 38 CR monkeys (~ 28 years) lived on average two years longer than the 38 CON monkeys (~ 26 years). In other words, when half of the monkeys had died in each group, the average age of the remaining monkeys were 28 and 26 for the CR and CON groups, respectively.
In contrast to the 2009 story for the UW study extending lifespan, the 2012 headline from the Wall Street Journal was Big Calorie Cuts Don’t Equal Longer Life, Study Suggests. This article was reporting on the publication of the NIA study results (Mattison et al., 2012). “One thing that’s becoming clear is that calorie restriction is not a Holy Grail for extending the life span of everything that walks on earth,” Rafael de Cabo, the lead author of the NIA study, told the WSJ. The CR monkeys, the WSJ reported, lived no longer than the controls.
Before getting to the (important) fact that the monkeys in the NIA study entered at various ages (from 1-23 years old), amongst other notable differences, if we just average the raw median survival data (Mattison et al., 2017), the 57 CR monkeys (~ 28 years) lived on average one year less than the 57 CON monkeys (~ 29 years).
So what gives? Well, there’s good news and bad news. The bad news is, surprise surprise, this is way more complicated than the headlines suggest. Not the first time, nor the last. The good news is, well, the same. The inadvertent contrast between these two studies offers us a potentially once-in-a-generation insight in the utility of caloric versus dietary restriction (i.e., restricting total energy intake versus restricting a type of energy intake).
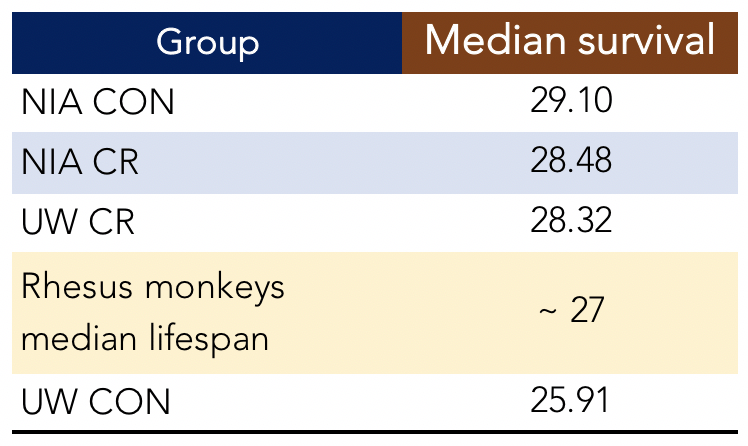
Figure 1. Median survival averages from the UW and NIA studies and reported median lifespan for rhesus monkeys as a species. UW data from Colman et al., 2014. NIA data is the mean median survivals of all groups in each (CON and CR) cohort, fromMattison et al., 2017.
Diet composition
One of the biggest methodological differences between the UW and NIA studies was diet composition, though such an obvious difference was barely mentioned in the press. In the UW study, both the CR and control group were put on a “semipurified” diet of “food-like substances,” as Michael Pollan would call them. The UW monkeys, prior to the study, consumed a “Purina Monkey Chow” diet, consisting of many of the same foods that you’ll see in the NIA study’s diet, below (Figure 2). Between the diet composition of the UW and NIA studies, and what rhesus monkeys reportedly eat in the wild, there were some substantial differences. Figure 2 represents the reported macronutrient composition of the diets in human terms.
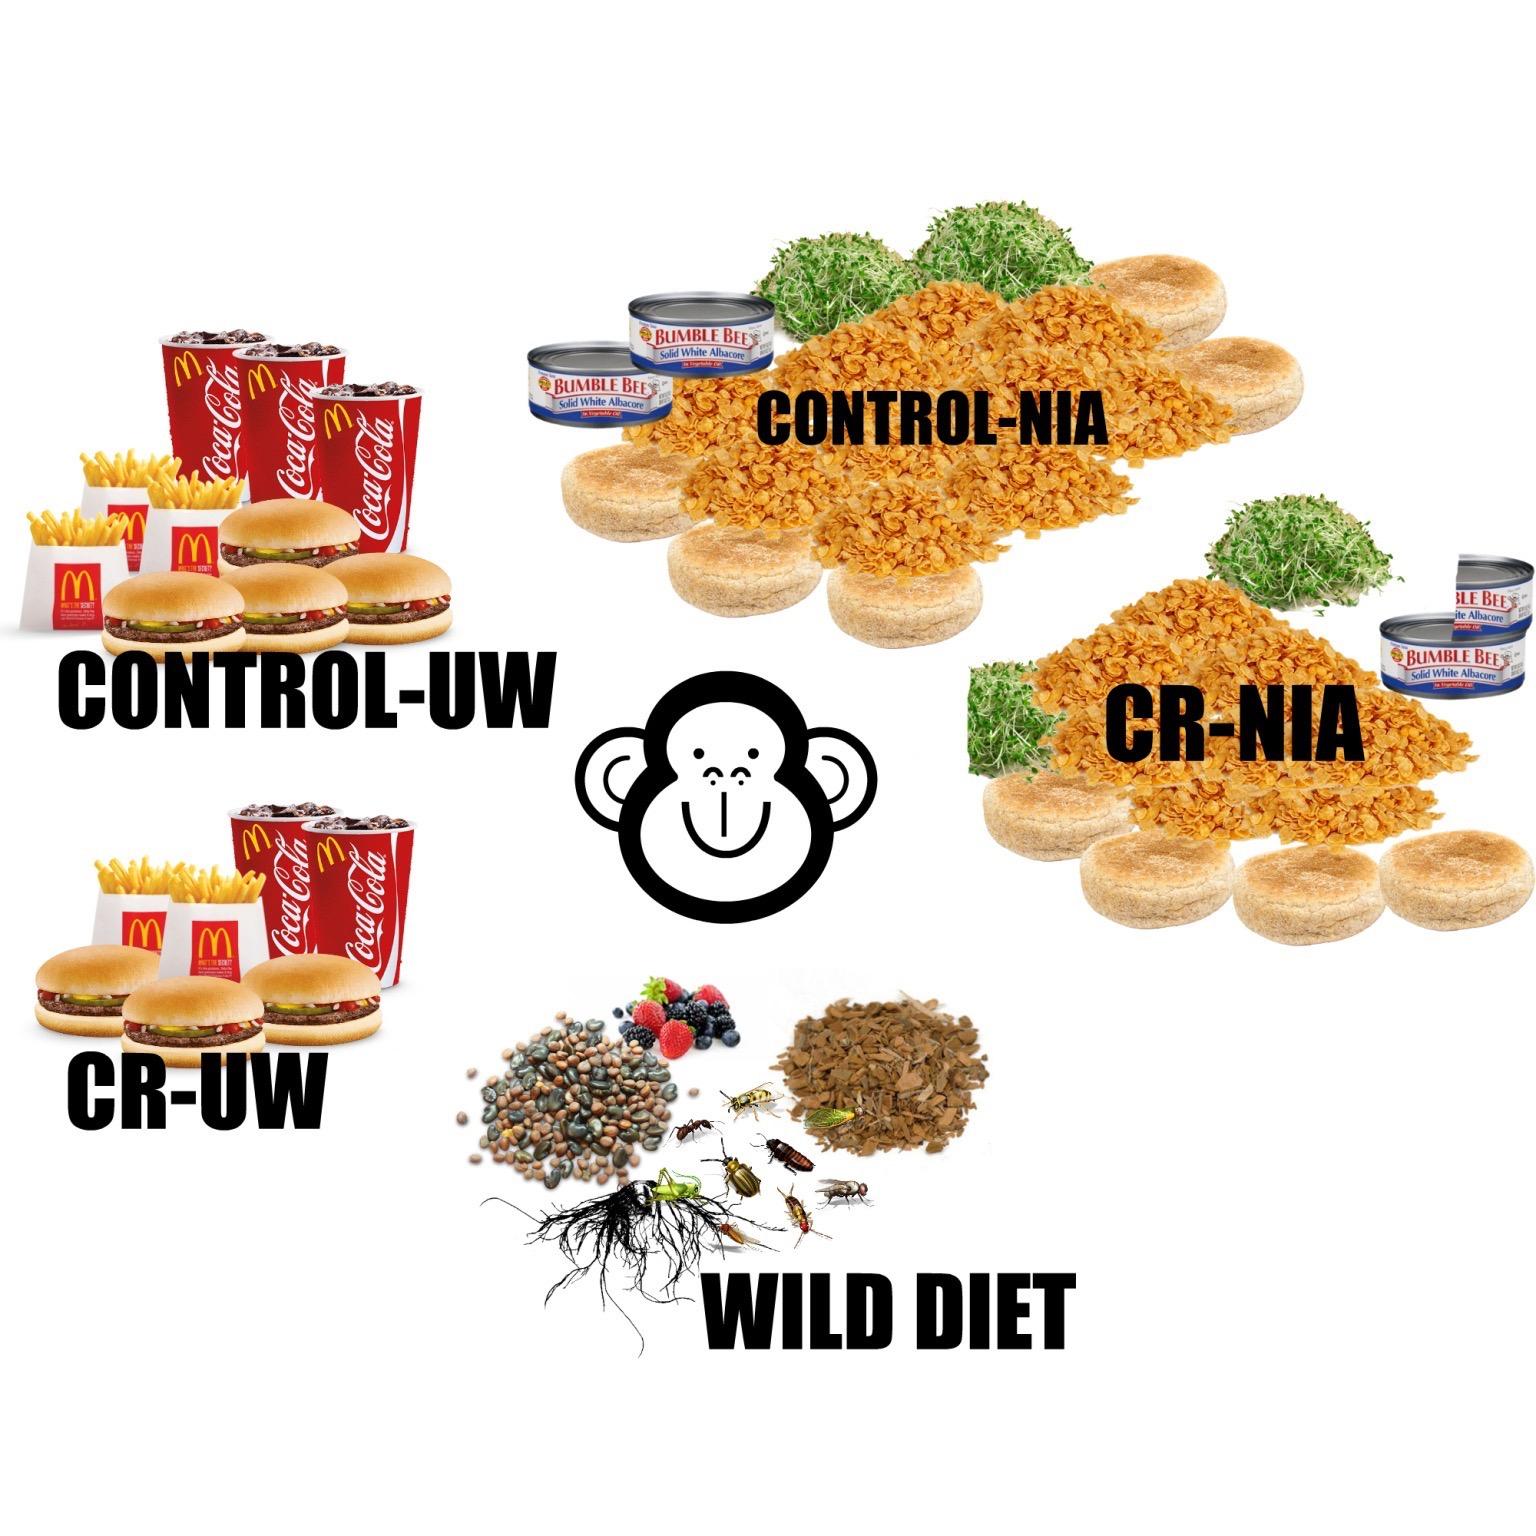
Figure 2. Macronutrient compositions of the NIA, UW and wild-type diets demonstrated by representative foods in the human diet. Amounts represent approximately 2,030 calories a day for the UW control group and about 1,440 for the UW CR group, an estimated 29% reduction in calories compared to the freely-fed (during the day) control group. This is scaled up to human-equivalent volume for comparison. The CON monkeys eat about 40% of this total (approximately 800 kcals per day).4
The human fast-food equivalent of the UW CON daily diet is:
- 4 Hamburgers 5
- 3 Small Fries
- 3 12-ounce sugar-sweetened sodas
The UW CR diet equivalent:
- 3 Hamburgers
- 2 Small Fries
- 2 12-ounce sugar-sweetened sodas
For the NIA study monkeys, it would be challenging for them to eat foods from a traditional fast food joint because their diet consists mainly of wheat, corn, soybean, fish, and alfalfa meal for the protein; fat from soy oil (and the oils from the other ingredients: corn, wheat, and fish) (Ingram et al., 1990).
The NIA CON diet equivalent:
- 10 Cups of Corn Flakes
- 5 English Muffins
- 2 Cans of Tuna with a little oil
- 2 Cups of Alfalfa Sprouts
The NIA CR diet equivalent:
- 8 Cups of Corn Flakes
- 4 English Muffins
- 1.5 Cans of Tuna with a little oil
- 1.5 Cups of Alfalfa Sprouts
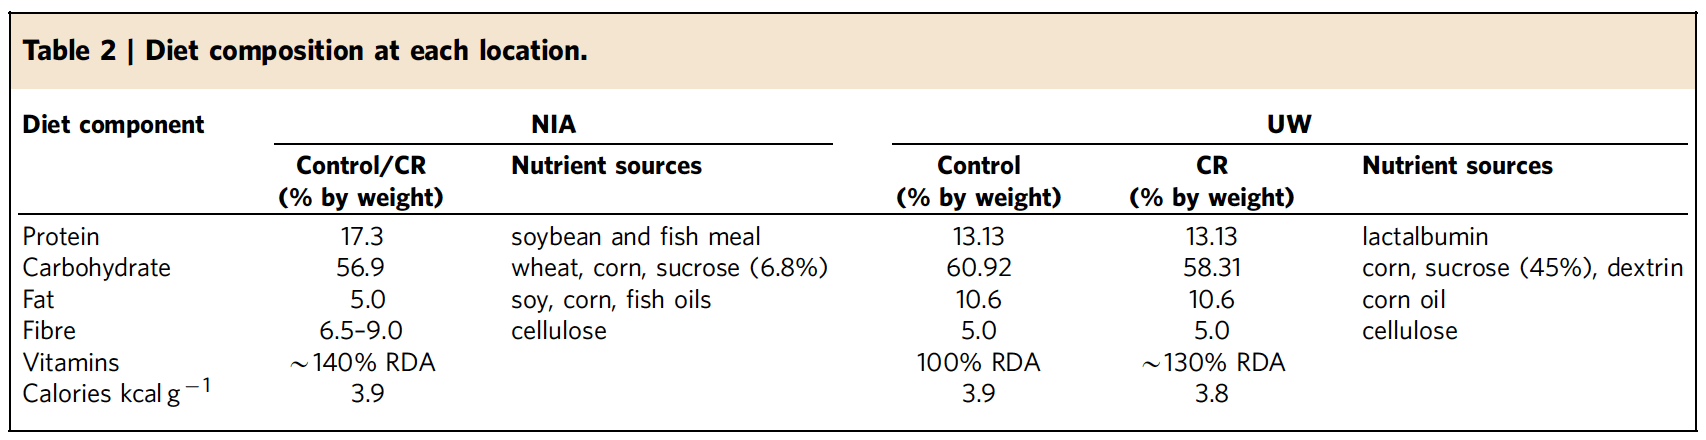
The UW monkeys were getting just under 29% of their daily kcals from sucrose (i.e., table sugar), 30% from corn starch, 5% from dextrin, and 10% from corn oil (Kemnitz et al., 1993; Ramsey et al., 2000) (Table 1).
Table 1. Diet composition at each location. Table reprinted from Mattison et al., 2017 (CC by 4.0).
The NIA study diet looked more like a “health-conscious” pescatarian diet. In both the UW and NIA studies, monkeys were also provided a snack, typically consisting of a piece of fruit. The NIA diet is not exactly a carbon copy of the roots, fruit, seeds, and bark, insects and small animals that rhesus monkeys typically eat in the wild, but it’s probably closer than the UW by virtue of the low amounts of sugar and corn oil and higher concentrations of non-purified foods, in particular.
Diet quantity
Many have speculated that the reason why the NIA study didn’t observe an increase in survival and that the CON NIA monkeys lived longer on average than the UW CR monkeys is because the UW CON monkeys were fed ad libitum (i.e, as desired, with no restriction in intake) and the NIA CON monkeys were not.
The reality is that at both UW and NIA the CON monkeys were fed a portioned amount, but were adjusted to be ad libitum. At UW, all monkeys were fed in the morning and any remaining food was removed later in the day, “when a treat of fresh fruit or vegetable, which was quickly and completely eaten, was provided,” write the investigators (Mattison et al., 2017). “Food allotment for control animals was adjusted to ensure that there was always some uneaten food to be removed at the end of the day. In this way, UW animals were ad libitum fed during the day but food deprived overnight.”
At NIA, “The amount provided to CON monkeys was determined to be approximately ad libitum because during regular measurements of food consumption,” write the investigators (Mattison et al., 2005), “monkeys in the CON group were observed to leave a few uneaten biscuits each day in the cages or on the screens below the cages.” In other words, the CON monkeys at both sites were able to eat as much as they wanted, but there were more restrictions regarding when the UW monkeys had food available (more on this below).
Did the UW monkeys eat more than the NIA monkeys?
The first thing to realize before answering this question is that the number of calories obviously varied at different points of the monkeys’ lives. Mattison and her colleagues (2017) provide a figure with trends of intake over the years (Figure 3).
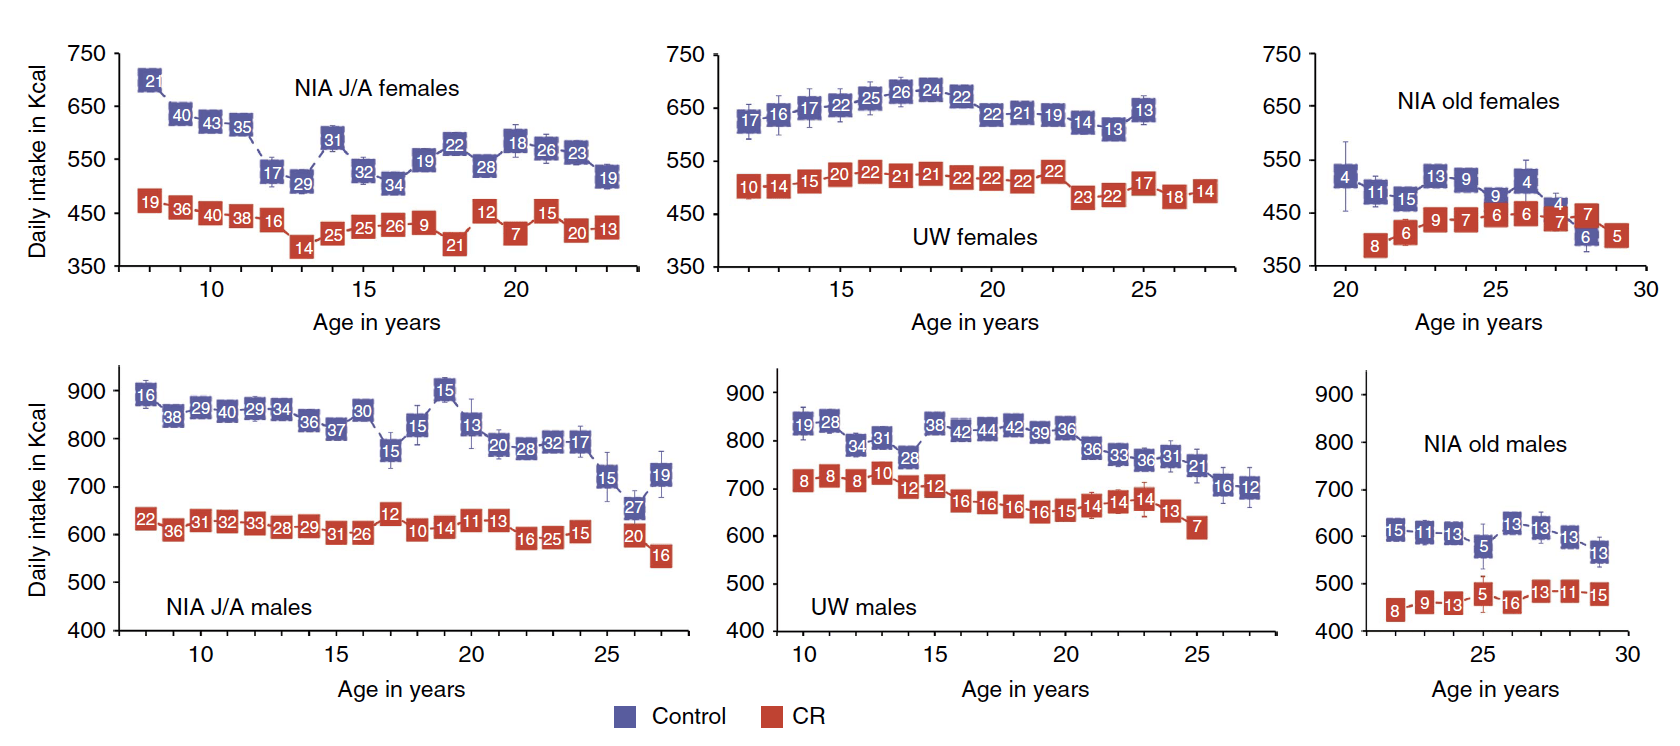
Figure 3. Food intake data for monkeys at NIA and UW. Figure reprinted fromMattison et al., 2017 (CC by 4.0).
Looking at the averages (Table 2), you might argue that the NIA CON monkeys were on a 14% CR diet compared to the UW CON monkeys, and that’s why the NIA CON monkeys lived longer. But why did the NIA CON monkeys live a little longer the NIA CR monkeys when they were eating 29% more kcals?
Table 2. An estimated average of lifetime daily kcals for the UW and NIA monkey groups.
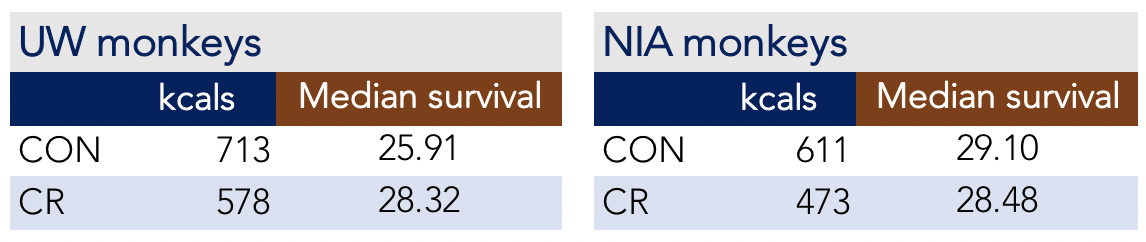
Why are the UW CON monkeys eating 17% more kcals than the NIA CON monkeys (or vice versa) when both were eating approximately ad libitum diets? Keep in mind that these are rough estimates over the lifetime of the studies, and also note that it appears in some groups the kcals start to converge (Figure 3), where the severity of restriction decreases over time.
BY: PETER ATTIA, MD
* This article is a repost which originally appeared on PETER ATTIA, MD.


No comment yet, add your voice below!